Read the Full Paper
MNRAS Publication
"First measurement of the characteristic depletion radius of dark matter haloes"
View on arXiv ↗Summary
This paper conducted the first-ever empirical measurement of the "depletion radius"—a physical boundary of dark matter haloes previously identified only in simulations (see Paper 2). Using real-world observational data from the DESI Legacy Imaging Surveys, I validated that the depletion radius exists in nature, not just in computational models.
Data Visualization
The figures in this paper demonstrate the ability to communicate complex observational results through thoughtful visual design. Each figure was created using Python (Matplotlib, Seaborn) with custom visualization pipelines.
Figure 1: Phase Space Visualization
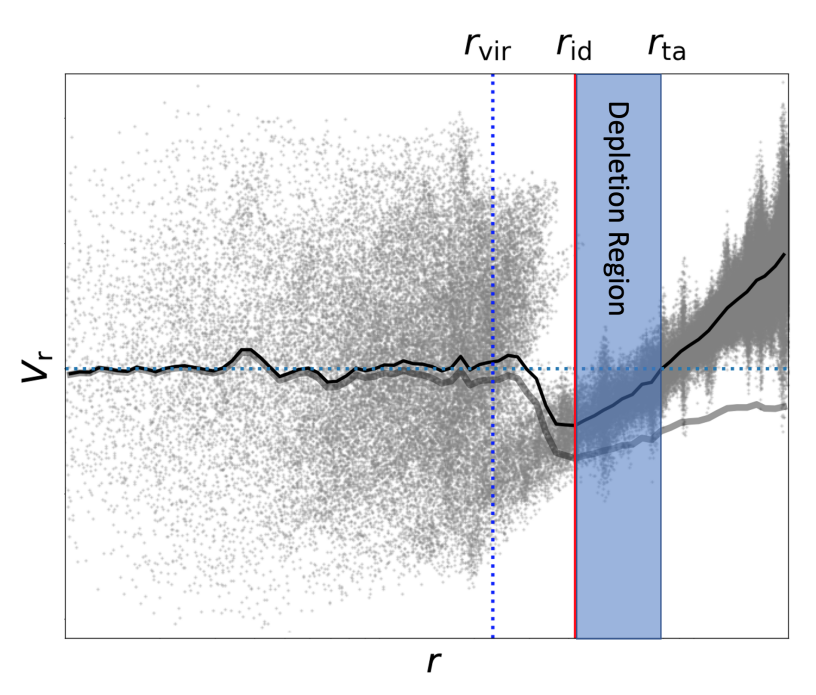
Data science approach: Phase-space density estimation using kernel-based methods on millions of particle positions and velocities. The layered visualization (density colormap + reference lines) encodes multiple data dimensions simultaneously, enabling identification of distinct dynamical populations.
Figure 2: MCMC Fits for Mass-Binned Haloes
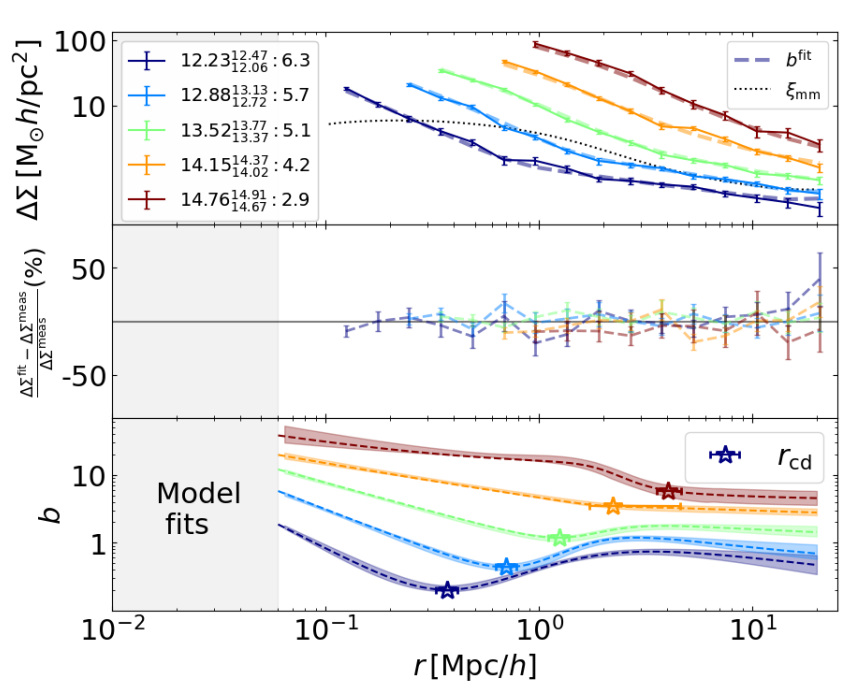
Data science approach: Bayesian parameter estimation using MCMC sampling to fit theoretical models to observational data. The multi-panel layout enables direct comparison across mass bins, revealing how the depletion radius scales with halo mass. Uncertainty bands communicate the precision of the measurements.
Figure 3: Characteristic Radii vs. Halo Mass
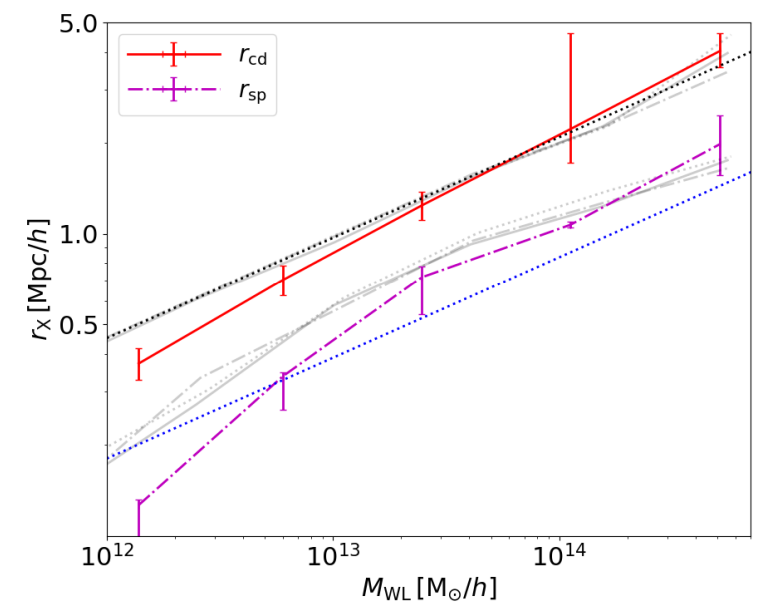
Data science approach: Model validation through comparison of observational measurements with simulation predictions. The scaling relations reveal the physical connection between halo mass and boundary locations, providing a predictive framework for future observations.
Figure 4: Depletion vs. Splashback Radii
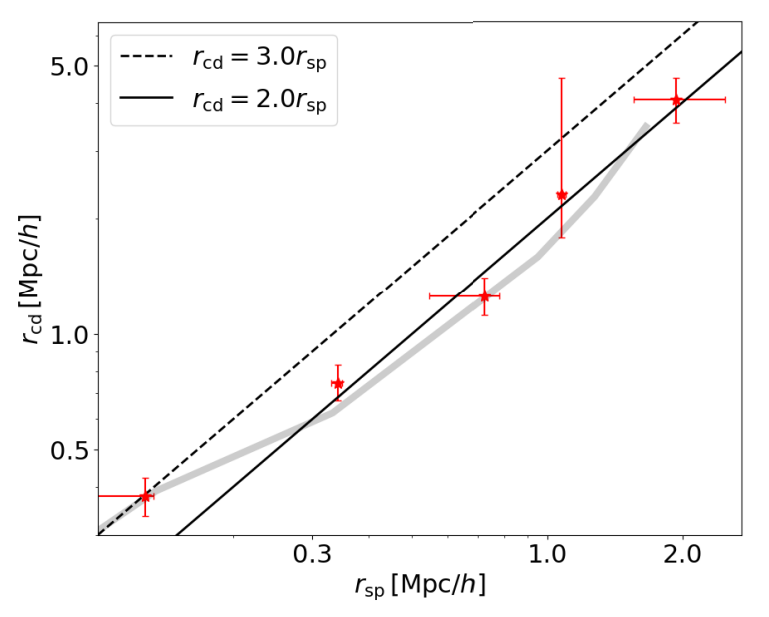
Data science approach: Correlation analysis between two derived physical quantities. The scatter plot with error bars communicates both the central relationship and the measurement uncertainties, enabling assessment of the physical connection between these boundary definitions.
Data Pipeline & Architecture
The core technical challenge was designing a pipeline to cross-match massive halo catalogs with source galaxy imaging data across different survey releases:
- Halo catalog: Galaxy group catalogs constructed from spectroscopic surveys, providing halo mass estimates and positions
- Source imaging: DESI Legacy Imaging Surveys DR8 and DR9, providing galaxy shape measurements for weak lensing analysis
- Cross-matching: Spatial matching of lens (halo) and source (background galaxy) catalogs across survey footprints with careful selection criteria
- Shear estimation: Fourier_Quad pipeline for robust shape measurement, converting galaxy ellipticities into gravitational shear estimates
- Stacking analysis: Signal averaging across thousands of halos to extract the weak lensing signal with sufficient signal-to-noise ratio
Pipeline Architecture Significance
This pipeline is essentially a large-scale ETL (Extract, Transform, Load) system: ingesting data from multiple astronomical surveys, transforming it through statistical processing stages, and producing validated scientific measurements. The cross-matching and quality control requirements mirror challenges in enterprise data engineering.
Statistical Methodology
- Stacked weak lensing: Combining signals from individual halos to build statistically significant radial profiles
- Fourier_Quad shear estimation: Fourier-space method for measuring galaxy shapes, more robust than real-space approaches for noisy data
- MCMC parameter estimation: Markov Chain Monte Carlo sampling to fit theoretical density profile models and extract characteristic radii with uncertainties
- Profile fitting: Fitting theoretical density profile models to the observed lensing signal to extract characteristic radii
- Statistical validation: Bootstrap resampling, systematic error estimation, and comparison with simulation-based predictions
Key Results
- Confirmed the existence of the depletion radius in observational data for the first time
- Measured depletion radius values consistent with N-body simulation predictions
- Demonstrated that the depletion radius provides physical information beyond traditional halo boundary definitions (virial radius, splashback radius)
- Validated the theoretical framework established in Paper 2 using independent observational evidence