Read the Full Paper
MNRAS Publication
"Prospects for determining the mass distributions of cluster-sized haloes using weak gravitational lensing"
View on arXiv ↗Summary
This paper was a feasibility study for the Large Synoptic Survey Telescope (LSST, now Vera C. Rubin Observatory). The core question: will next-generation survey data have sufficient quality to distinguish between the traditional NFW density profile model (used for 20+ years) and the newer DK profile (which incorporates the physics of mass accretion)? This is fundamentally a model selection and forecasting problem.
Data Visualization
The figures in this paper demonstrate the ability to communicate model comparison results and feasibility assessments through thoughtful visual design. Each figure was created using Python (Matplotlib, Seaborn) with custom visualization pipelines.
Figure 1: NFW vs. DK Profile Comparison
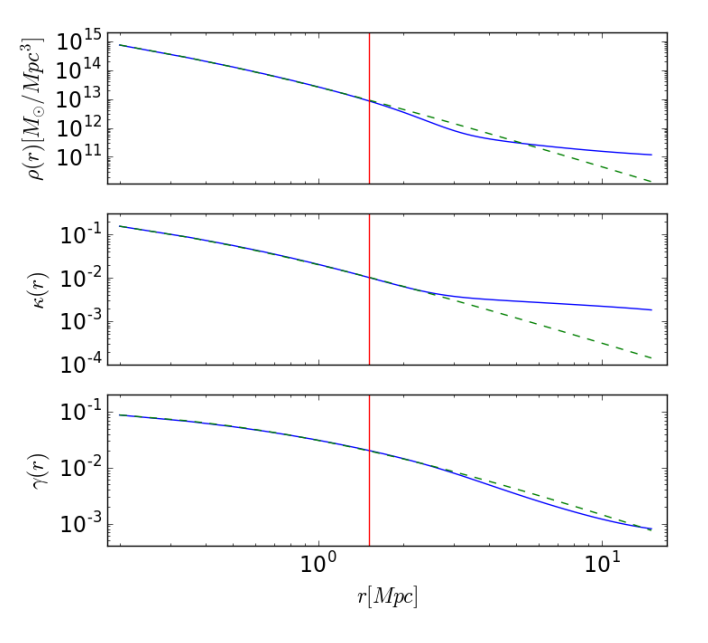
Data science approach: Multi-panel comparison of theoretical models across different observable quantities. The stacked layout enables direct visual comparison of where the models agree (inner regions) and diverge (outer regions), informing where observational data will have the most discriminating power.
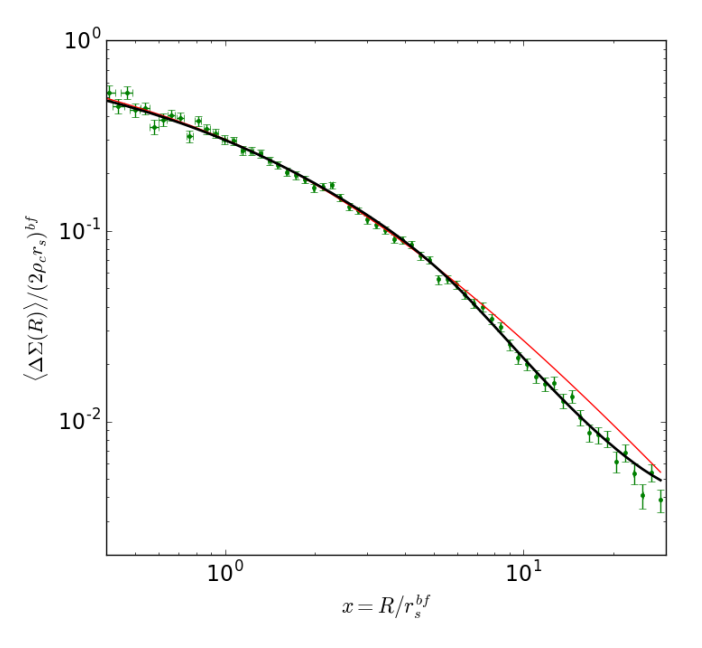
Figure 2: Shear Forms for NFW and DK Profiles
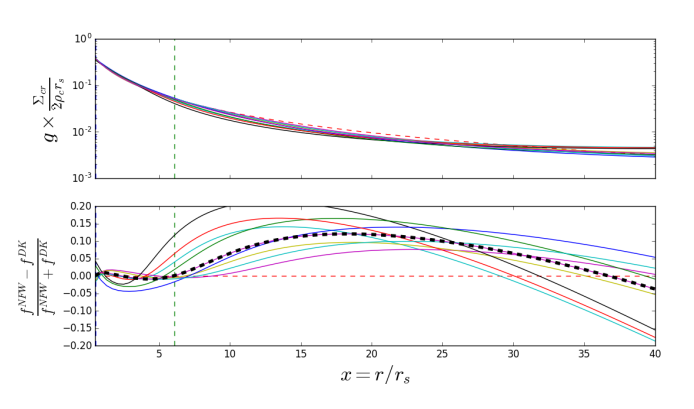
Data science approach: Dimensionless scaling to reveal universal behavior. By plotting the scaled shear form, we identify which aspects of the profile are universal (NFW self-similarity) versus parameter-dependent (DK outer regions), informing the fitting strategy and parameter constraints.
Figure 4: DK vs. NFW Mass Estimates
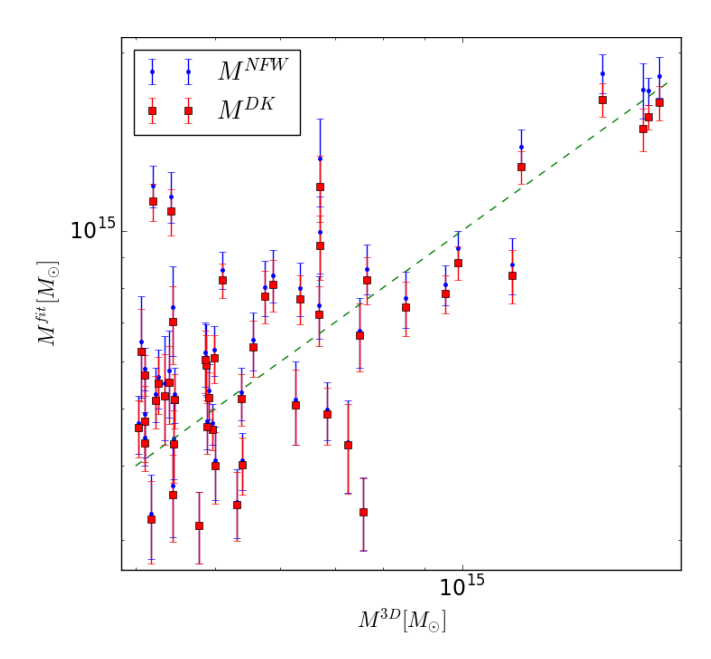
Data science approach: Model validation through comparison with ground truth. The scatter plot with identity line enables visual assessment of bias (systematic offset from the line) and precision (scatter around the line) for each model, directly informing which model provides more accurate mass estimates.
Figure 7: Triaxiality Visualization
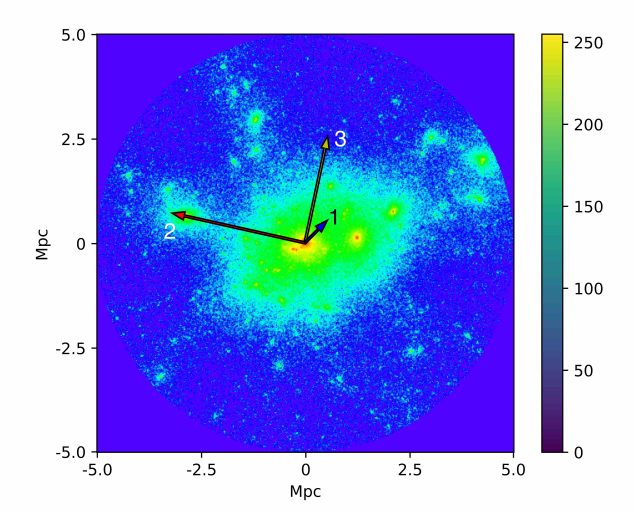
Data science approach: Visualization of systematic effects. By overlaying the 3D shape information (principal axes) on the 2D observable (convergence map), we communicate how projection effects can bias mass estimates, motivating the need for stacking analyses that average over random orientations.
Figure 8: Stacking Analysis Results
Data science approach: Signal averaging to increase statistical power. Stacking is analogous to ensemble methods in machine learning—by combining many noisy individual measurements, we extract a cleaner signal that reveals the underlying model behavior.
Data Pipeline
- Simulation source: Cosmo-OWLS simulations providing realistic halo density profiles with full baryonic physics
- Synthetic lensing generation: Creating mock weak lensing measurements with realistic noise properties matching LSST specifications (source density, shape noise, photometric redshift errors)
- Profile fitting: Fitting both NFW and DK models to the synthetic data using Bayesian parameter estimation
- Signal-to-noise forecasting: Computing how profile distinguishability scales with survey depth, source density, and halo mass
Industry Parallel: Technology Evaluation
This paper is structurally a technology evaluation / competitive analysis: given a new "product" (DK profile) and a market standard (NFW profile), under what conditions does the new product demonstrably outperform? The methodology—synthetic data generation, controlled comparison, sensitivity to deployment conditions—maps directly to product feasibility studies and A/B test design.
Statistical Methodology
- Bayesian model comparison: Computing Bayesian evidence for NFW vs. DK profiles to determine which model is preferred by the data
- Signal-to-noise forecasting: Predicting the survey conditions under which the DK profile becomes statistically distinguishable from NFW
- Parameter degeneracy analysis: Identifying which DK profile parameters are well-constrained vs. degenerate with observational uncertainties
- Parameterized accretion modeling: The DK profile encodes the mass accretion history of haloes through its outer slope parameter, providing physical information not available from NFW fits
Key Results
- LSST-quality data will be sufficient to distinguish DK from NFW profiles for massive galaxy clusters
- The outer regions of halo profiles (beyond the virial radius) contain the most discriminating power between models
- Accretion rate information can be extracted from DK profile fits, providing physical insights not available from traditional NFW analysis
- Identified the minimum signal-to-noise thresholds needed for robust model selection, informing survey strategy and analysis pipeline design