Read the Full Paper
MNRAS Publication
"The impact of baryonic physics and massive neutrinos on weak lensing peak statistics"
View on arXiv ↗Summary
This paper investigated how non-dark-matter factors—specifically baryonic physics (gas, stars, feedback processes) and massive neutrinos—affect the cosmological signals that future surveys will use to measure the universe's properties. Using the BAHAMAS simulation suite, I created synthetic observational catalogs through ray-tracing to determine whether these factors would lead to biased scientific conclusions.
Data Visualization
The figures in this paper demonstrate the ability to communicate complex simulation results and sensitivity analyses through thoughtful visual design. Each figure was created using Python (Matplotlib, Seaborn) with custom visualization pipelines.
Figure 1: NFW Filter Function for Aperture Mass
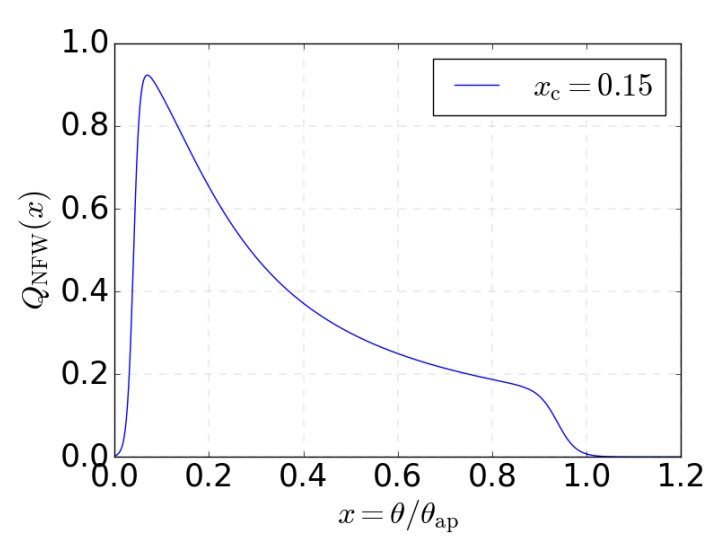
Data science approach: Filter design for signal extraction in noisy data. The compensated filter (positive core, negative annulus) is analogous to edge detection kernels in image processing, optimized for the expected signal profile of galaxy clusters.
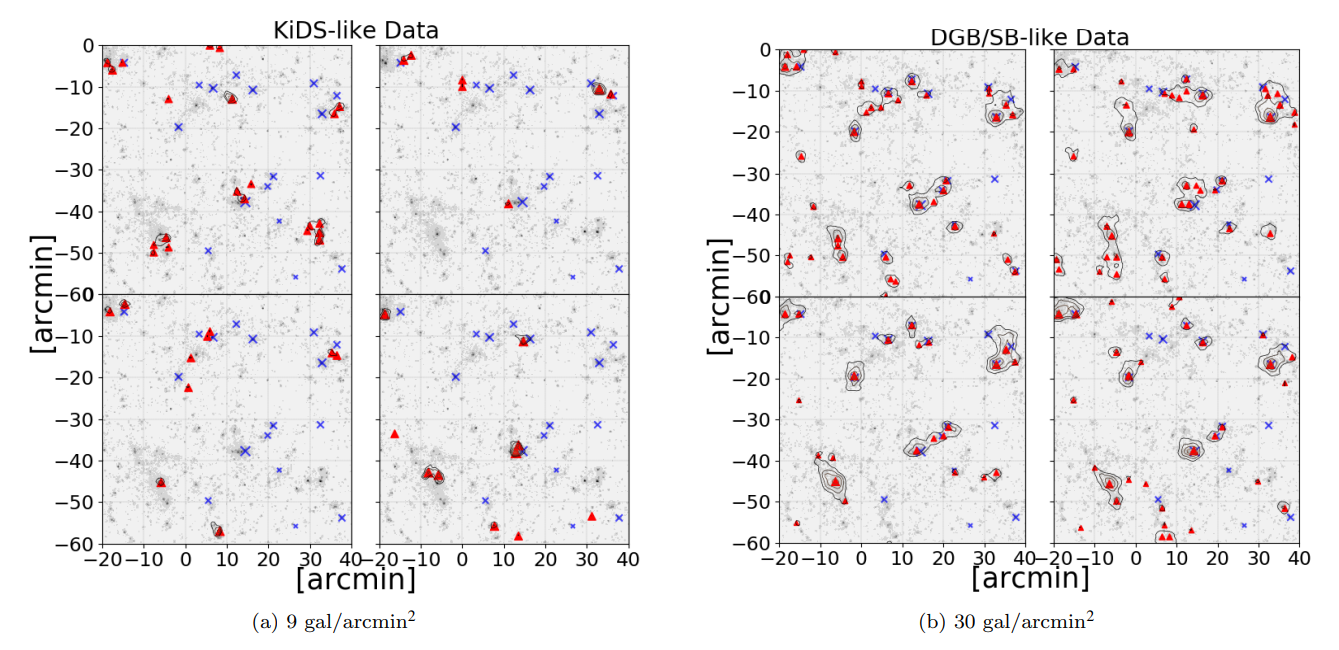
Figure 2: S/N Contours on Convergence Map
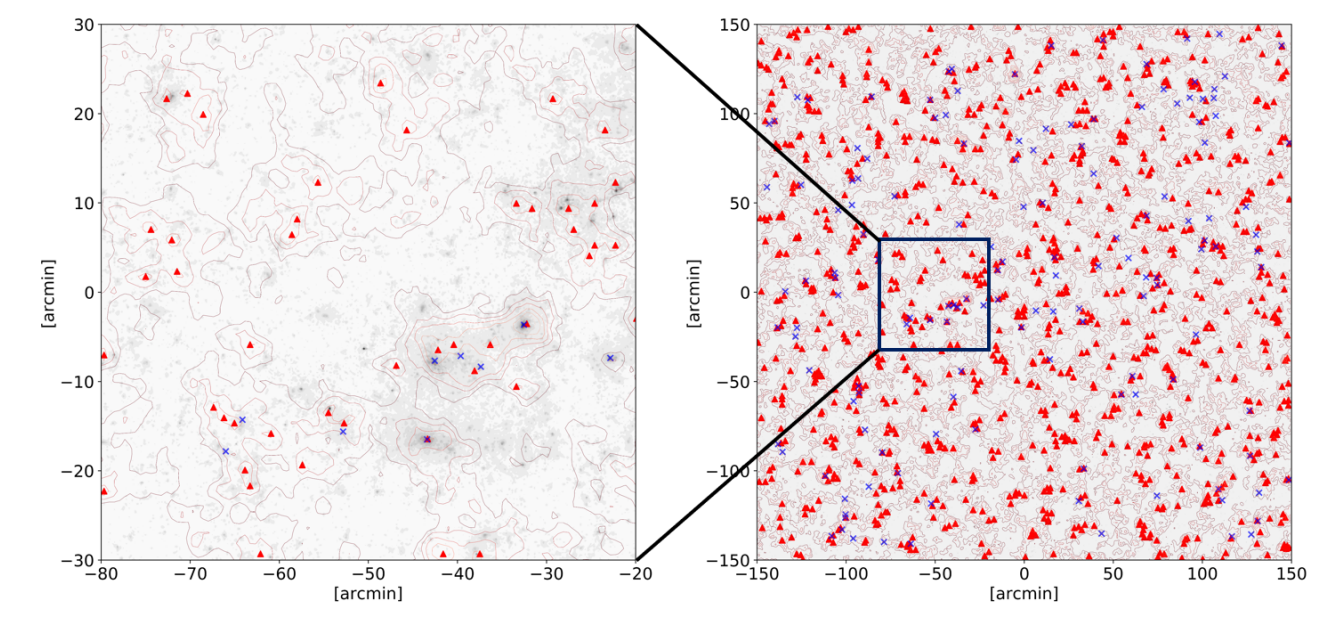
Data science approach: Multi-layer visualization combining continuous data (convergence map), derived statistics (S/N contours), and catalog information (cluster positions). This enables visual validation of the peak detection algorithm against known cluster locations.
Figure 5: Halo Mass Function and S/N Peak Distributions
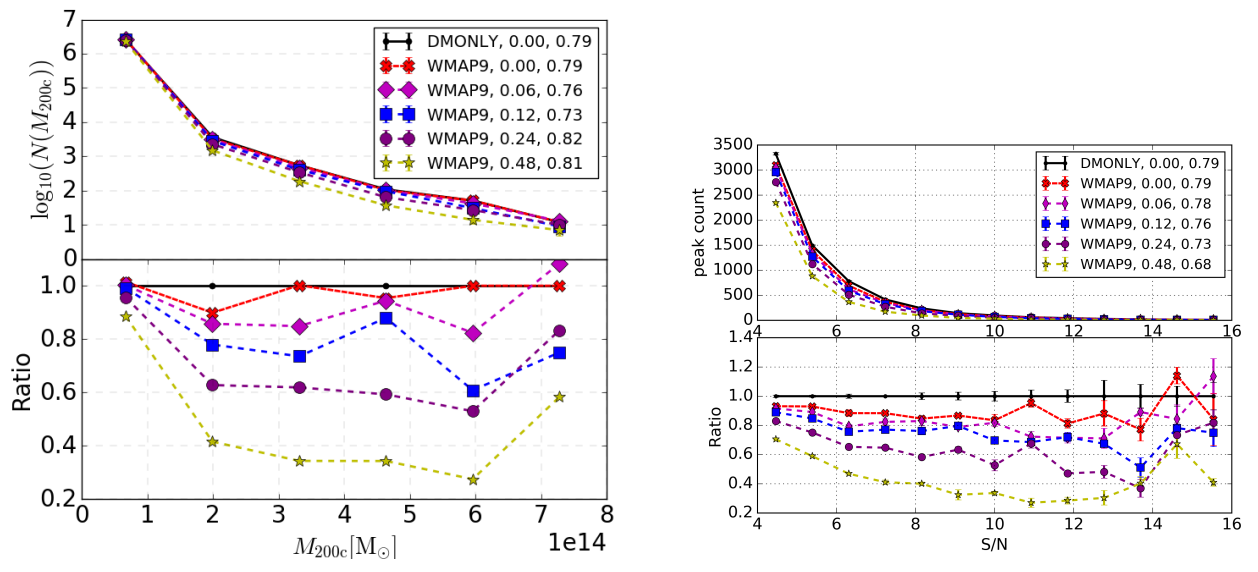
Data science approach: Controlled comparison across simulation configurations, analogous to A/B testing in industry. By holding all other parameters constant and varying only the physics model, we isolate the causal impact of each effect on the observable statistics.
Figure 7: Relative Differences in Peak Counts
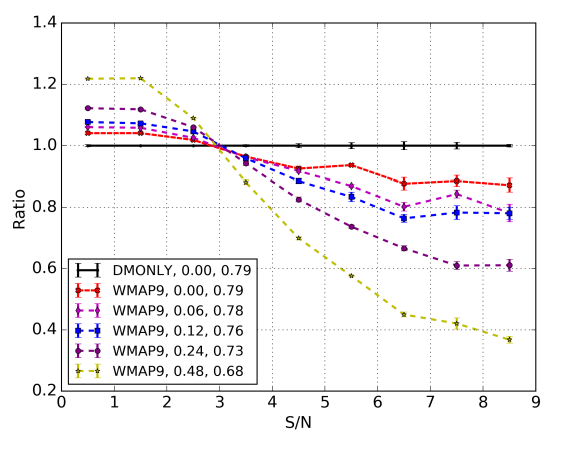
Data science approach: Quantifying systematic biases through relative difference metrics. This visualization directly communicates the magnitude of the systematic error that would result from ignoring these physical effects in survey analysis pipelines.
Figure 9: S/N Peaks vs. Halo Mass
Data science approach: Feature engineering for parameter inference. The S/N-mass relation encodes information about the underlying cosmology, and the mass-dependent impact of neutrinos provides a pathway to constrain fundamental physics from observational data.
Data Pipeline & Architecture
This project involved managing a complex, multi-stage simulation and analysis pipeline:
- Simulation suite management: BAHAMAS provides multiple simulation runs with different physics configurations (dark-matter-only, with baryons, with neutrinos of varying masses), enabling controlled comparisons
- Ray-tracing through light-cones: Tracing simulated photon paths through the simulation volume to generate synthetic weak lensing maps, replicating how real telescopes observe the universe
- Synthetic catalog generation: Converting ray-traced maps into mock observational catalogs that mimic the properties of real survey data (galaxy positions, shapes, noise characteristics)
- Aperture mass statistics: Computing peak statistics from the synthetic maps to quantify the lensing signal in a way that is sensitive to cosmological parameters
- Sensitivity analysis: Comparing statistics across simulation configurations to isolate the impact of each physical effect
Pipeline Architecture Significance
This is essentially a large-scale simulation-to-observation ETL pipeline running on HPC systems. The ray-tracing component alone involves tracing billions of light paths through a 3D simulation volume—a massively parallel computing problem. Managing multiple simulation configurations and ensuring apples-to-apples comparisons mirrors the challenges of A/B testing and controlled experiments in industry.
Statistical Methodology
- Aperture mass statistics: Filtering-based approach to extract lensing signal at multiple angular scales, more robust than direct shear measurement for peak identification
- Peak counting: Identifying and characterizing overdensities in the lensing signal as a function of signal-to-noise threshold
- Covariance estimation: Computing the full covariance matrix of peak counts across bins, accounting for cosmic variance and shot noise
- Bias quantification: Measuring the systematic shift in inferred cosmological parameters when baryonic/neutrino effects are ignored
Key Results
- Baryonic physics significantly suppresses weak lensing peak counts, particularly at high signal-to-noise ratios
- Massive neutrinos produce a distinct signature that is partially degenerate with baryonic effects but can be distinguished with sufficient data quality
- Ignoring these effects would lead to biased cosmological parameter estimates in next-generation surveys, quantifying the systematic error budget
- Provided guidance for future survey analysis pipelines on which physical effects must be modeled to achieve target precision