Read the Full Paper
MNRAS Publication
"A natural boundary of dark matter haloes revealed around the minimum bias and maximum infall locations"
View on arXiv ↗Summary
This paper used large-scale cosmological N-body simulations to discover a "bias trough" that marks the boundary where dark matter haloes deplete their surrounding environment. This discovery established new physical scales—the Inner Depletion Radius and the characteristic depletion radius—that improve upon the traditional "virial radius" used for decades in astrophysics.
Data Visualization
The figures in this paper demonstrate the ability to communicate multi-dimensional statistical relationships through thoughtful visual design. Each figure was created using Python (Matplotlib, Seaborn) with custom visualization pipelines.
Figure 1: Multi-Parameter Bias Profiles
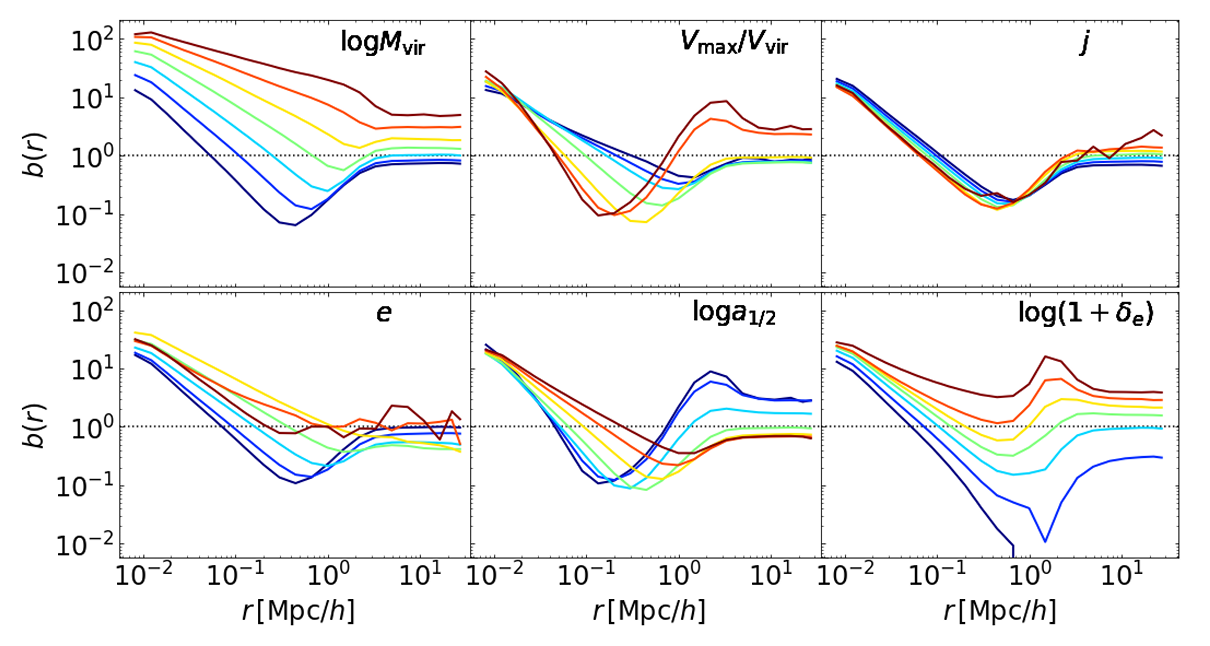
Data science approach: Six-panel grid enables systematic comparison of how different features (mass, velocity, spin, shape, formation time, environment) affect the target variable (bias profile). Color gradients encode parameter binning. Log-scale axes handle a large dynamic range. The horizontal anchor line at unity bias provides a consistent reference across all panels.
Figure 4: Two-Parameter Space Mapping
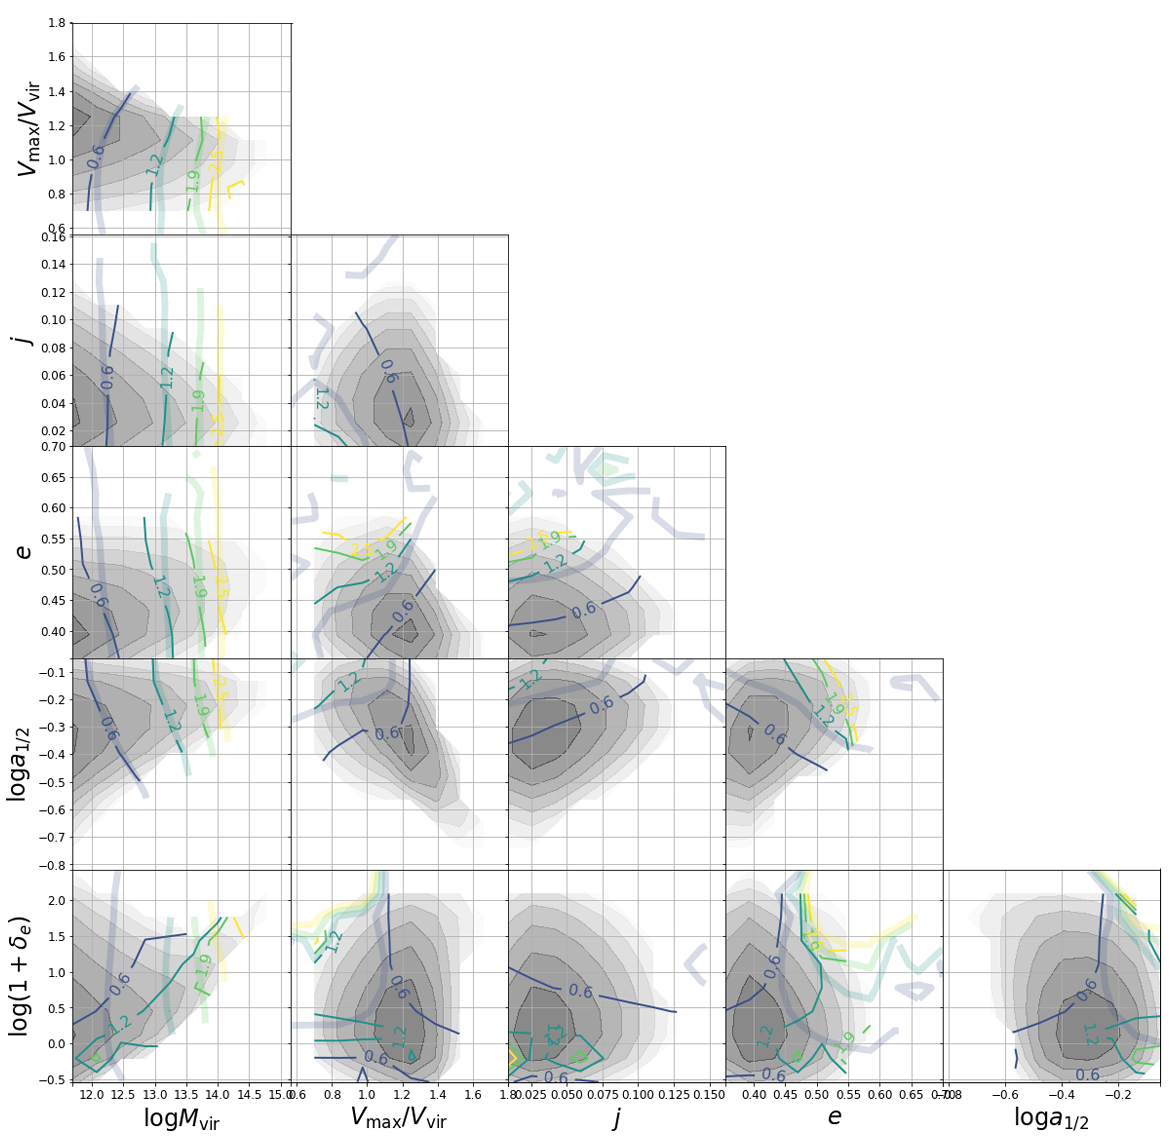
Data science approach: This 6×6 matrix visualization is a systematic feature interaction analysis. By overlaying measured values against Gaussian Process model predictions, the figure directly communicates where the model captures the data well and where residual complexity exists—a key diagnostic for model validation.
Figure 8: Theory Illustration
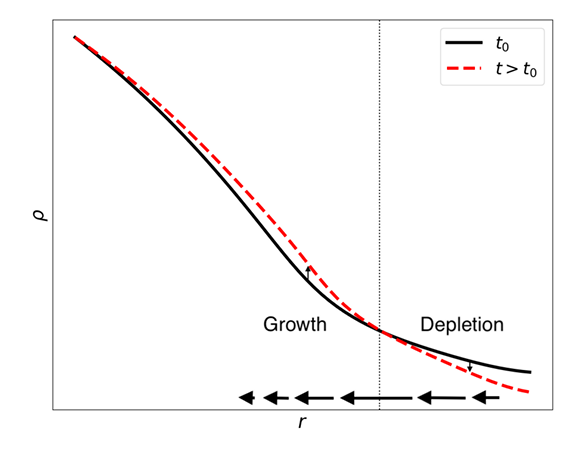
Data science approach: This conceptual diagram bridges quantitative results and physical interpretation. It translates velocity field measurements into an intuitive visual model of mass transport, making the mechanism behind the depletion boundary accessible to readers from different specializations.
Figure 9: Phase Space Dynamics
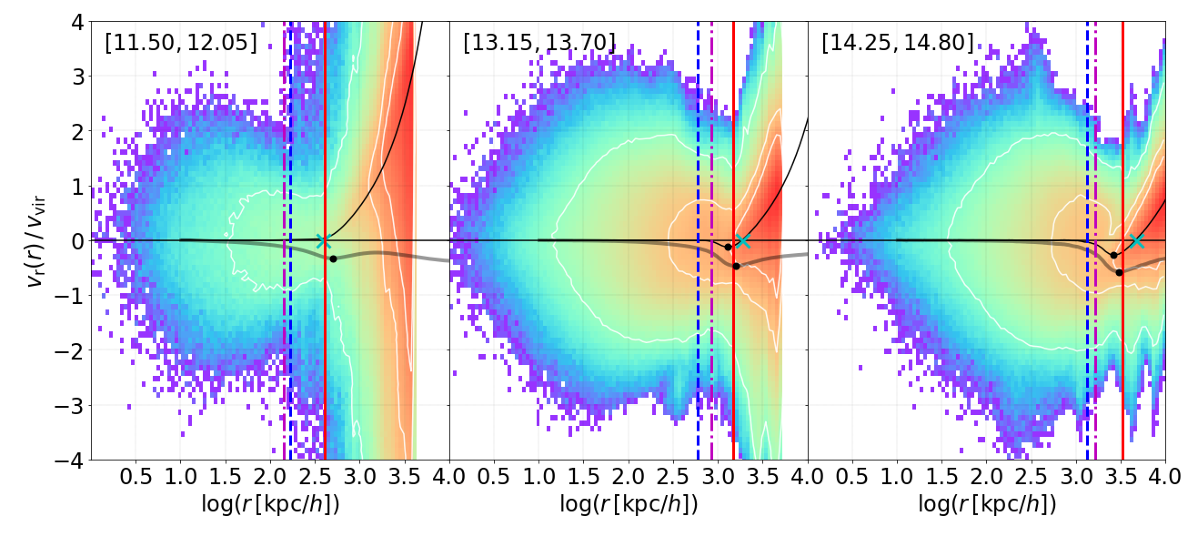
Data science approach: Phase-space density estimation using kernel-based methods on millions of particle positions and velocities. The layered visualization (density colormap + isodensity contours + reference lines) encodes multiple data dimensions simultaneously. Mass-binned panels enable direct comparison of how the underlying distribution shifts with the primary feature variable.
Note on Figure Availability
If the figures are not displaying, they need to be extracted from the PDF and placed
in the assets/images/figures/ directory. See the deployment instructions
for details.
Data Pipeline
- Simulation data: N-body cosmological simulations containing 8+ billion dark matter particles, tracking gravitational evolution of the universe
- Halo identification: Automated detection of gravitationally-bound structures (haloes) within the simulation volume
- Property extraction: Computing mass, velocity, spin, shape, formation time, and environmental density for each identified halo
- Bias profile computation: Calculating the ratio of local-to-average matter density as a function of distance from each halo center
- Phase-space analysis: Extracting radial velocity distributions for particle populations around haloes
Statistical & ML Methodology
- High-dimensional phase-space analysis: Examining particle distributions in position-velocity space to identify physical boundaries
- Gaussian Process Regression: Non-parametric modeling of the characteristic depletion radius as a function of multiple halo properties simultaneously
- Multi-parameter binning: Systematic analysis of bias profiles across 6 different halo parameters, individually and in pairs
- Velocity profile modeling: Decomposing radial velocity distributions into infall and splashback components to measure mass accretion rates
- Feature engineering: Identifying which combinations of halo properties most strongly predict the depletion boundary location
Data Science Significance
This work is fundamentally a feature engineering and predictive modeling problem: given a set of halo properties, can we predict the location of a physical boundary? The Gaussian Process Regression approach allowed non-parametric modeling of complex, non-linear relationships in high-dimensional parameter space.